
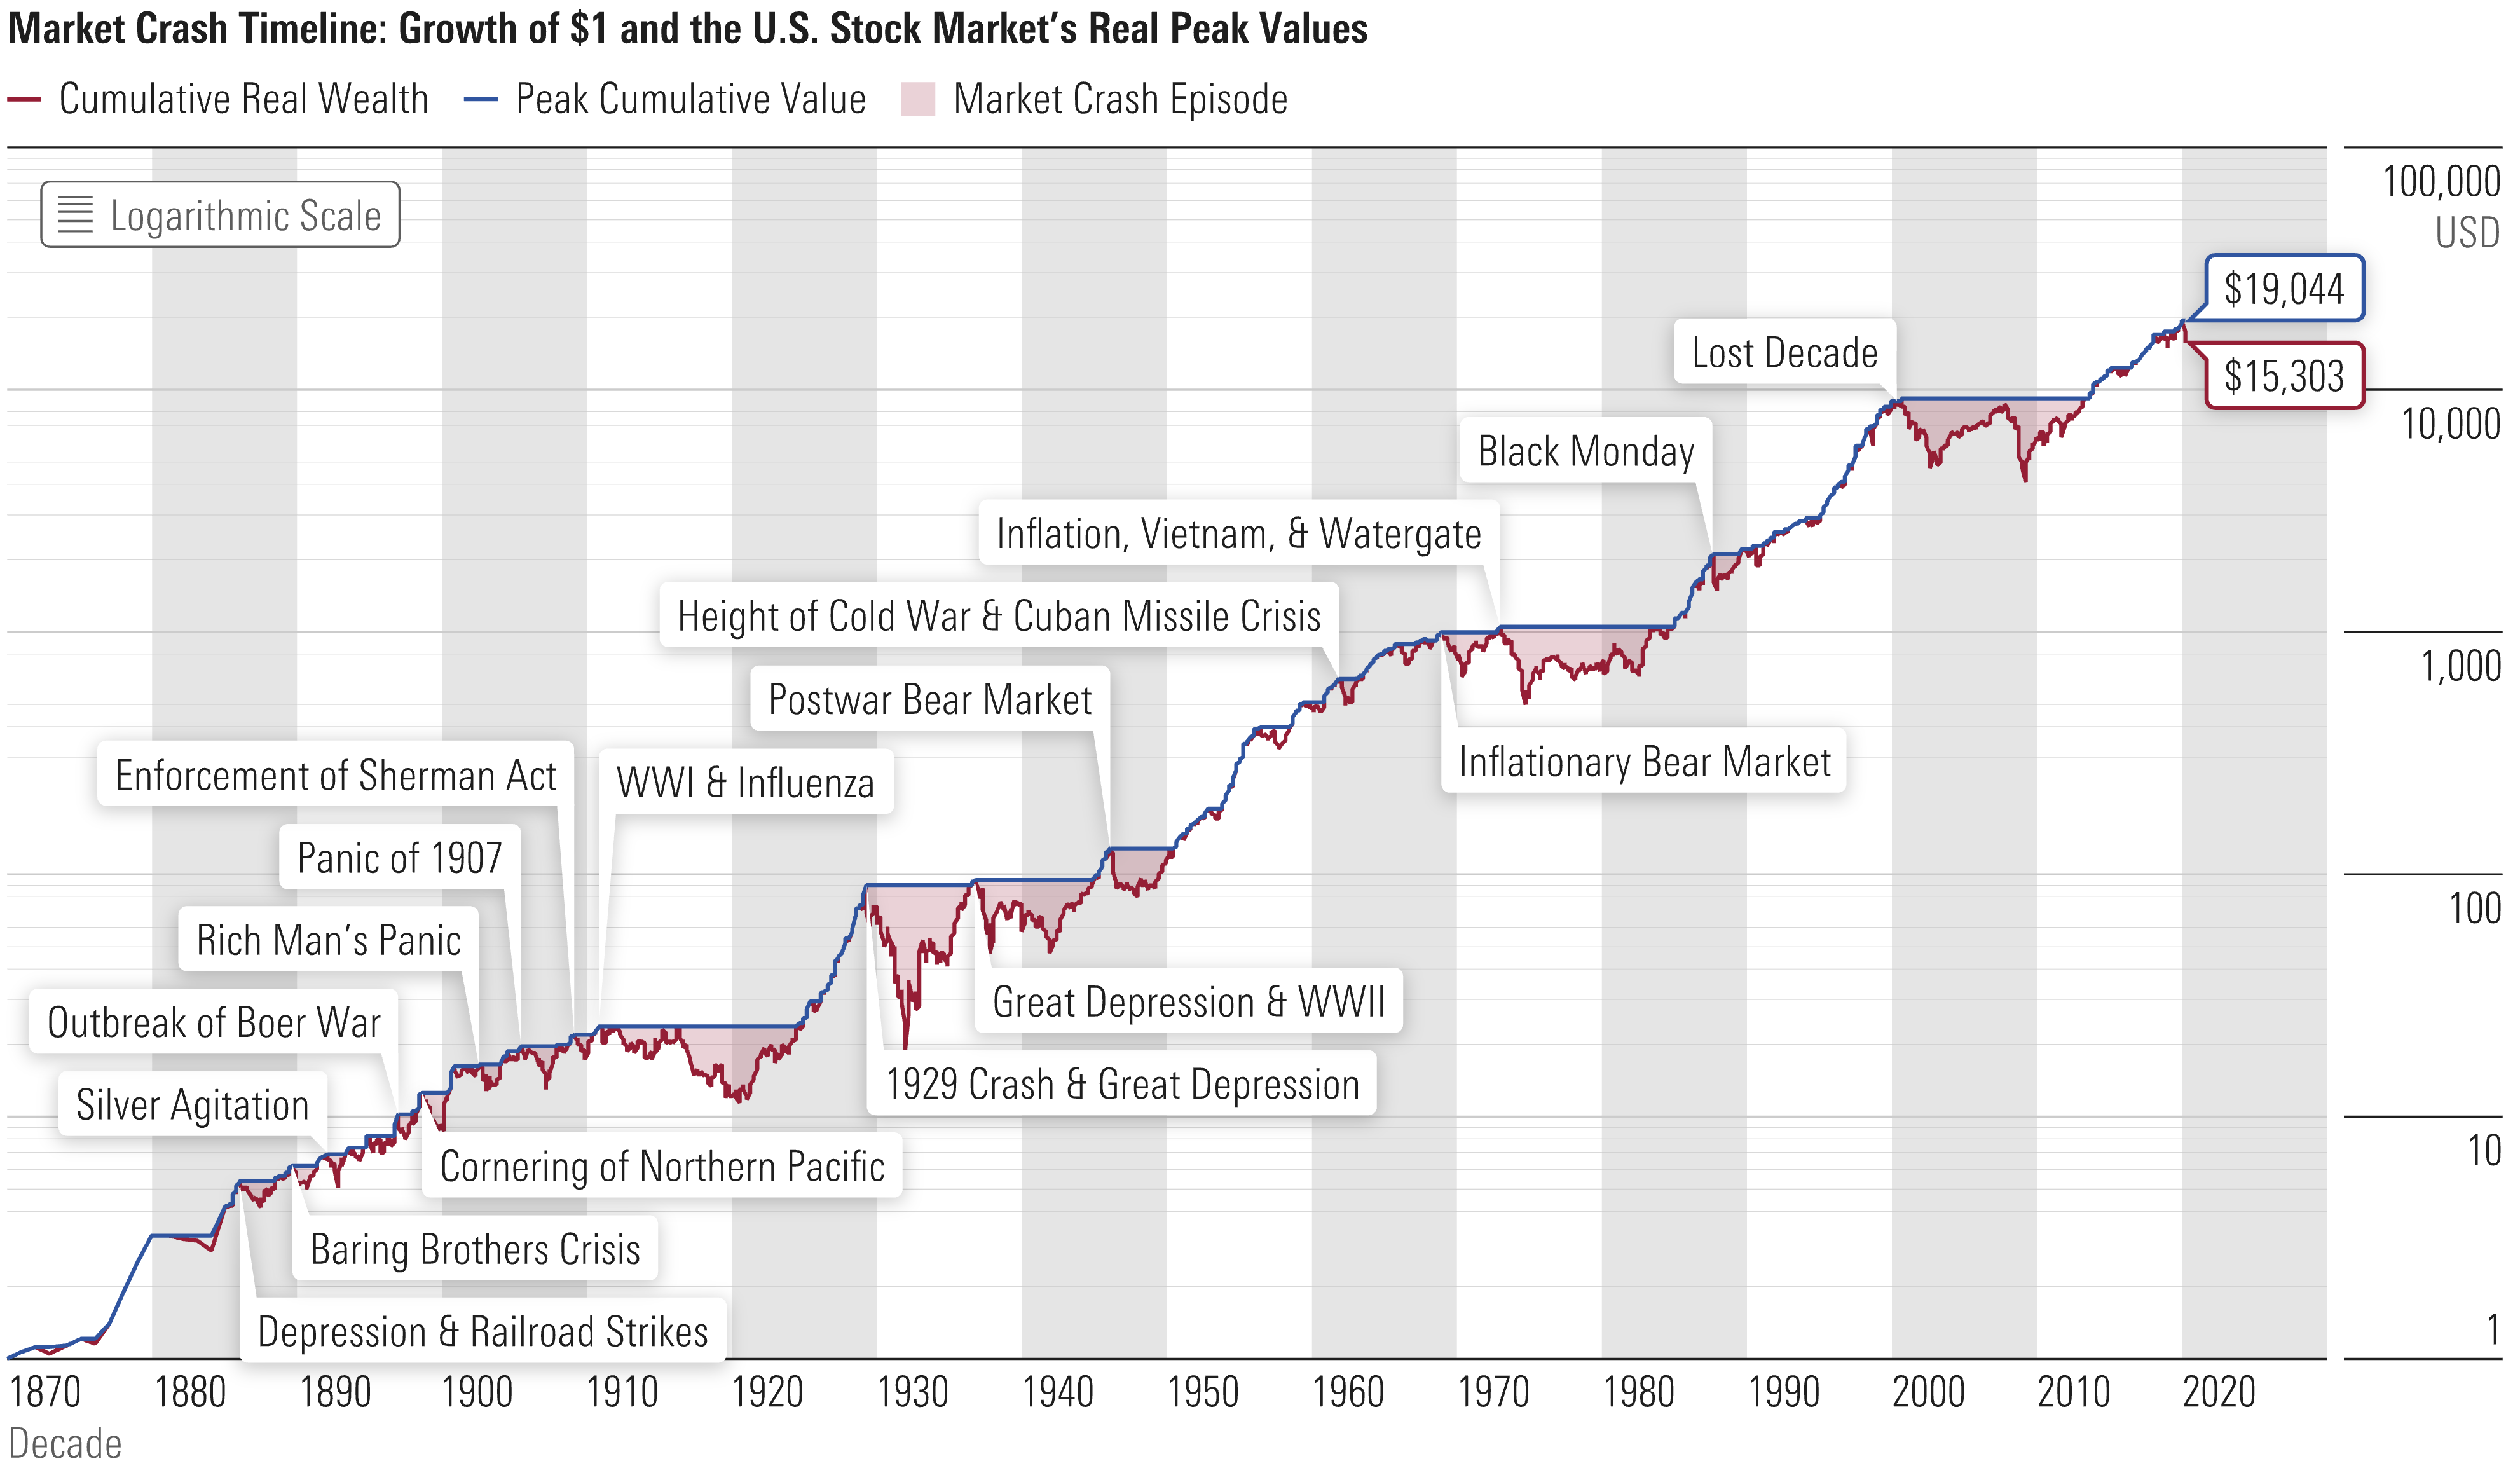
One of the most frequently asked questions I have heard mostly over the past month is “how long will markets take to recover”? The short and honest answer is of course “nobody knows”, and a recovery in stock prices is not the same (or as important as) sustained growth in underlying cash flows, so work has been quite busy for analysts like me looking through dozens of companies, sectors, and foreign markets to see which are more robust than others at being able to increase those cash flows over time. Taking a step back and looking at longer term history, we can get an “outside view” of what’s likely to happen based on what complex human systems have done before. Today’s chart is from an article featured on the front page of Morningstar.com looking at the history of 150 years of market crashes and what that can tell us about both economic and market price recoveries. The below chart is a PNG version of the SVG in the original article:

I recently wrote other comparisons about how the crash of 2020 compares with earlier crashes in 1929, 1987, 2000, and 2008, and why we shouldn’t try and time the bottom. I did point out in January of this year that US stocks were expensive, and tend to watch for a band of when they are relatively cheap, like in January of 2019, but overall have found that trying to time the market is less valuable than buying quality assets that can compound over more time in the market. That is why I continue to believe that it is best to try and buy some stocks every month, and only second best to try and buy more when stocks are in the red zones of the Morningstar chart.
Happy investing!