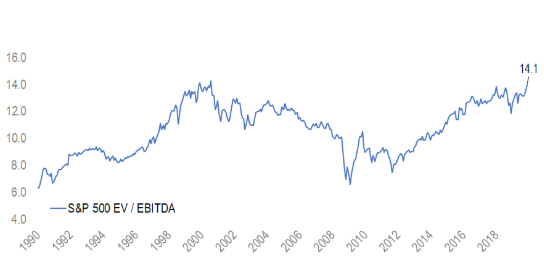
Today’s chart is thank’s to this tweet by the People’s Hedge Fund Manager, showing the EV/EBITDA valuation ratio of the S&P 500 US stock index over the past 30 years.
EV/EBITDA is sometimes called the “acquirer’s multiple”, and has certain advantages over Price / Earnings (P/E) as a valuation metric. Here are five earlier posts on P/E ratios I thought worth linking back to at this point:

