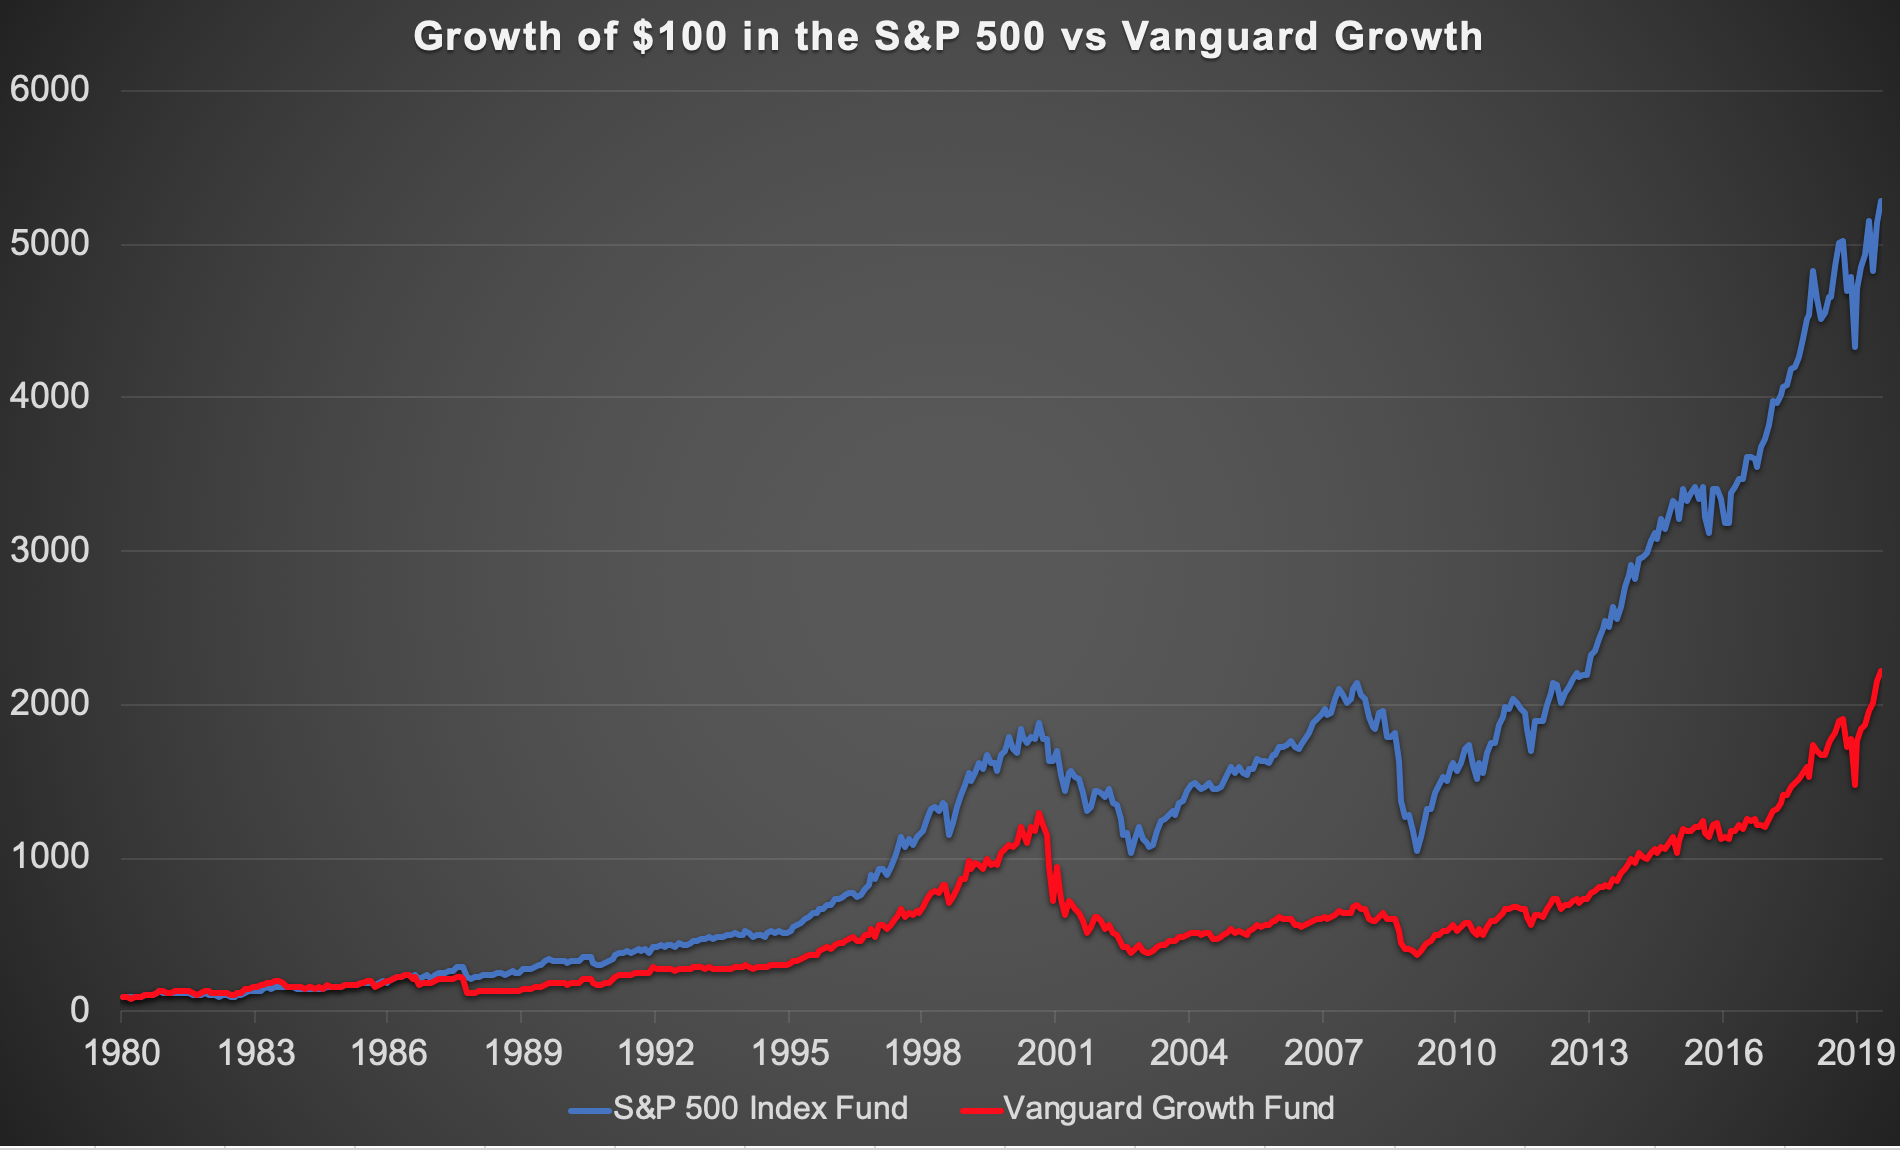
Following the last post’s chart showing how 75% of the returns investing in the S&P 500 came from dividends, this chart by how much Vanguard Growth Underperformed the S&P 500 over the past 40 years. Not only did the growth fund provide turn an investor’s 1980 $100 into a significantly lower sum ($2,222 vs $5,280 if invested in the broad index fund), the growth fund delivered this lower return with far more risk and volatility. In addition annual swings being on average 40% larger in the growth fund than the S&P index, the worst month and worst 5 year period for growth stocks were also both twice as bad.
I have long preferred to invest on the “value” side of the market, buying less expensive dividend payers and buyback achievers than “glamour” stocks promising higher growth. My point with this post is to point out how the last five years where growth has outperformed value (+71% for the S&P vs +114% for Vanguard Growth) is an anomaly similar to that of 1999-2000, which I expect to see corrected with in the next few years if not decade.


