40 years ago, in 1979, BusinessWeek published its now infamous cover “The Death of Equities“, after one of the worst decades for US stock investors over the past century. 20 years ago, in 1999, the Nasdaq was still soaring on the back of a .com technology stock bubble just as famously burst the following year. Stock investors since 2009 should be pleased that 2019 looks more like 1999 than 1979, though value-oriented investors have been wondering how much longer the recent anomaly of growth and momentum outperforming quality and value will last. With value vs growth trading at their widest spreads in 15 years, I’m going to argue that investors should tilt towards “Value, like it’s 1999”.
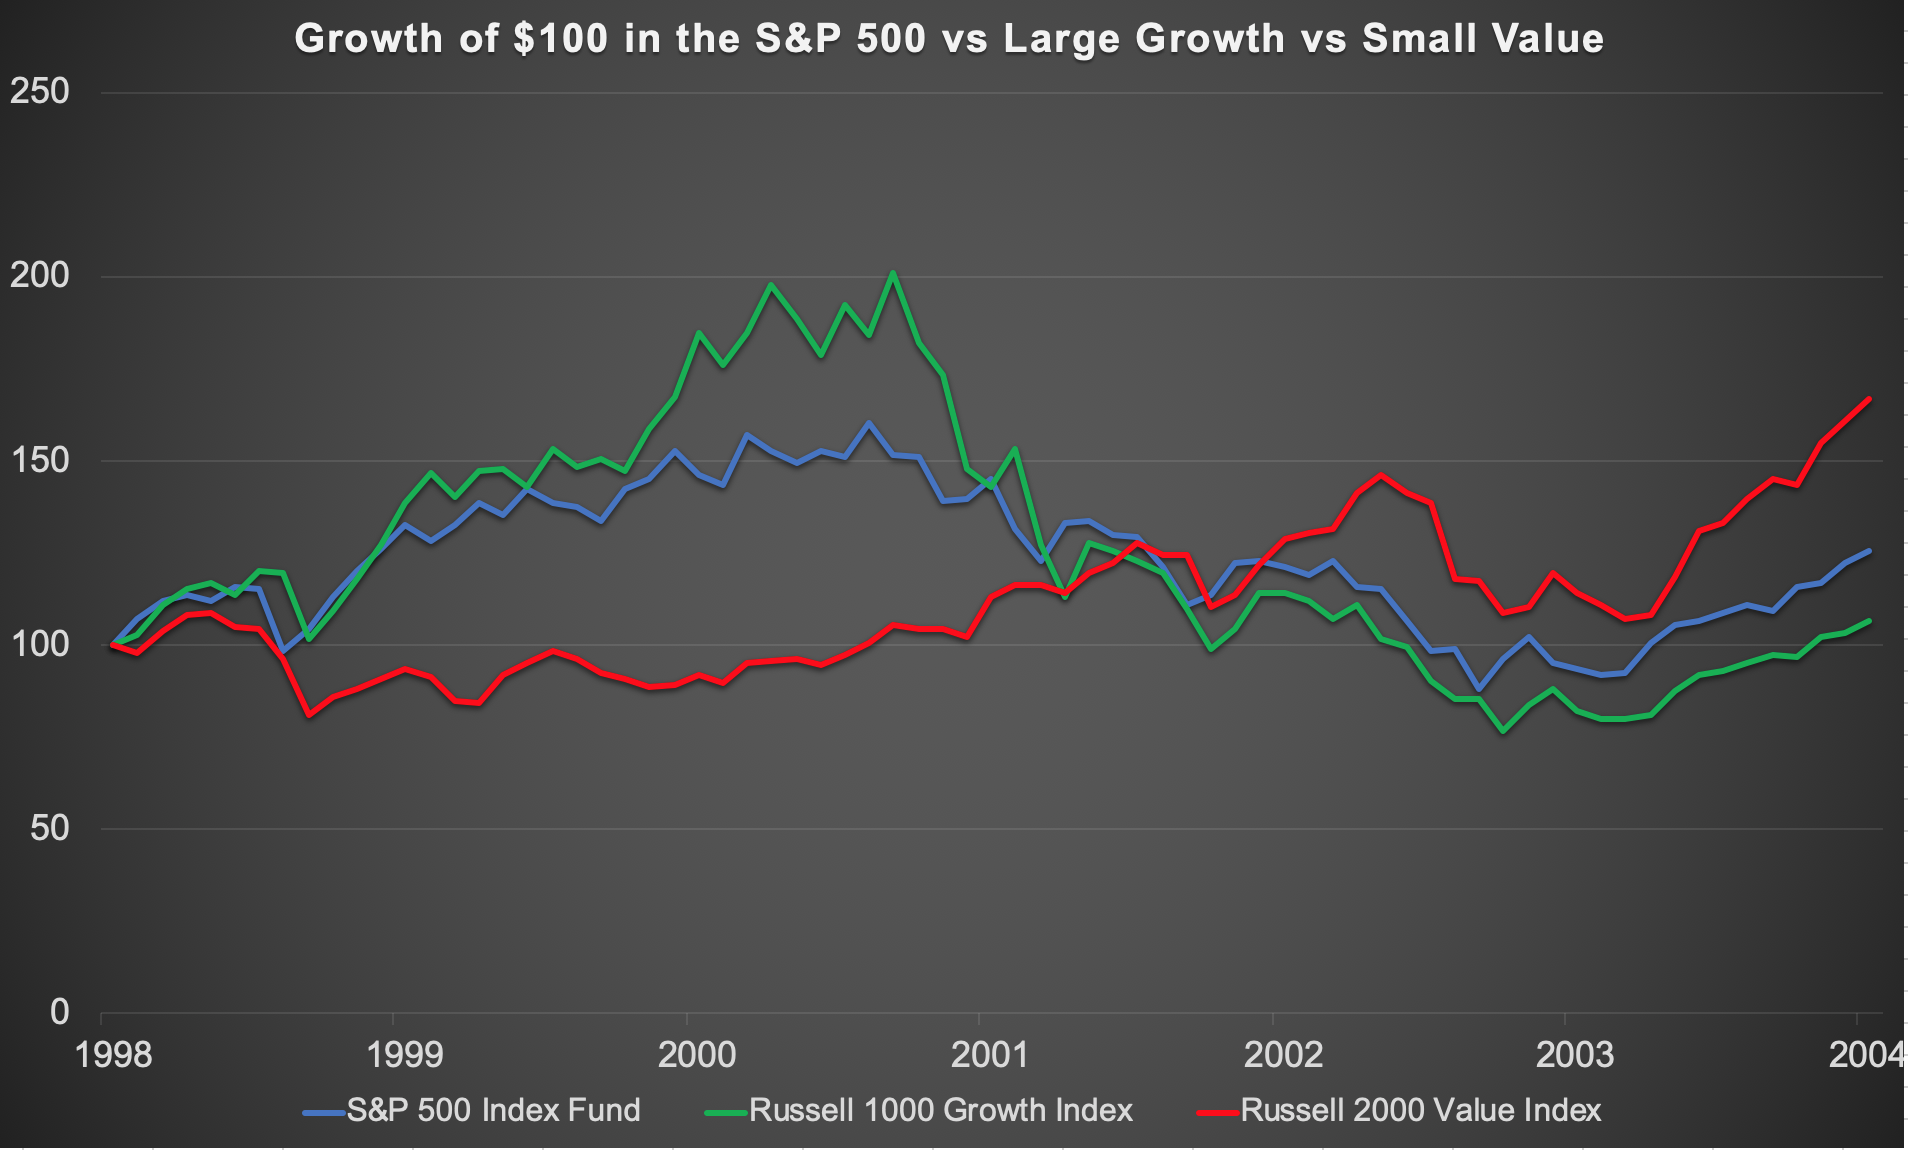
Today’s chart shows a flashback of how growth vs value performed in the 1998-2004 time period, specifically large growth (Russell 1000 growth) vs small value (Russell 2000 value) vs the S&P 500. Many of us at the time were focused on the bubble and pop of the broader market and the Nasdaq, much as it was pumped by the “growth” part of the market, it is easy to forget that the “value” part of the market had not run up, nor come down, as much or as violently as the growth part.
This chart answers two different questions for two different types of investors. If you have been invested in value over the past few years, and are frustrated with outperformance, remember what happened after the same pattern in 1999. If you are reluctant to get into the market thinking “everything is too expensive”, this chart is meant to remind you it is not “everything” that is expensive, and why value may save you from buying the top.


One thought on “Value like it’s 1999”
Comments are closed.