Skip to content
GFM Asset Management
  • About
  • Contact
  • FAQ
  • Platforms
    • 🌐 Interactive Brokers
    • πŸ‡­πŸ‡° iFast
    • πŸ‡¨πŸ‡­ Private Bank Accounts
    • πŸ‡ΊπŸ‡Έ Altruist
    • πŸ‡ΊπŸ‡Έ Vanguard
  • Retirement Plans
    • πŸ‡ΊπŸ‡Έ 401(k) plans
    • πŸ‡ΊπŸ‡Έ 529 college savings
    • πŸ‡ΊπŸ‡Έ IRA (Traditional & Roth)
    • πŸ‡ΊπŸ‡Έ HSA health savings
    • πŸ‡­πŸ‡° ORSO
Search
GFM Asset Management
Close menu
  • About
  • Contact
  • FAQ
  • Platforms
    • 🌐 Interactive Brokers
    • πŸ‡­πŸ‡° iFast
    • πŸ‡¨πŸ‡­ Private Bank Accounts
    • πŸ‡ΊπŸ‡Έ Altruist
    • πŸ‡ΊπŸ‡Έ Vanguard
  • Retirement Plans
    • πŸ‡ΊπŸ‡Έ 401(k) plans
    • πŸ‡ΊπŸ‡Έ 529 college savings
    • πŸ‡ΊπŸ‡Έ IRA (Traditional & Roth)
    • πŸ‡ΊπŸ‡Έ HSA health savings
    • πŸ‡­πŸ‡° ORSO
GFM Asset Management
Search Toggle menu

JP Morgan Large Cap Growth vs Small Cap Value 3×3 Grid, July 2020 edition

By quantofasiaJuly 31, 2020Investing

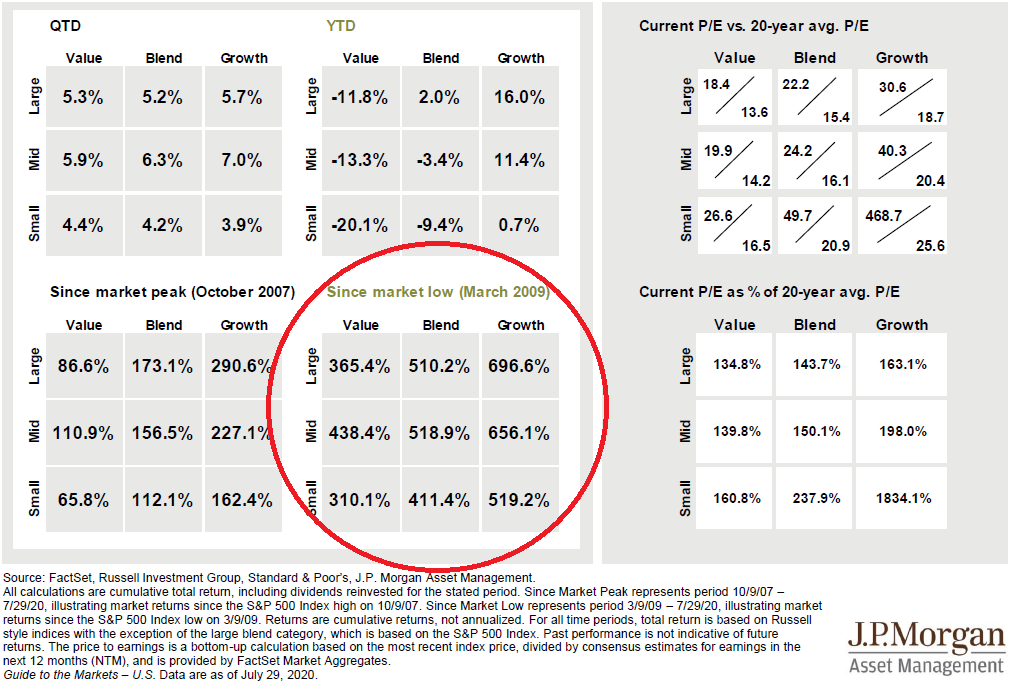
One tweet I found worth sharing today was this one by @NateGeraci showing JP Morgan’s 3×3 grid of past performance and current P/E ratios of large caps vs small caps and growth vs value stocks. Fans of Morningstar will be very familiar with the 3×3 style grid idea from there, and I have also written several posts here comparing large cap growth to small cap value, and the recent outperformance of the former to the dot-com bubble of 1999.

Share this:

  • Click to share on X (Opens in new window) X
  • Click to share on LinkedIn (Opens in new window) LinkedIn
  • Click to share on Facebook (Opens in new window) Facebook
  • Click to share on WhatsApp (Opens in new window) WhatsApp
  • Click to share on Reddit (Opens in new window) Reddit

Like this:

Like Loading...

Related

United StatesValue Investing

Post navigation

An easier way to find “the next Microsoft”
Dividend Growth For Higher Returns And Lower Risk, Long Term
© 2025 GFM Asset Management. Proudly powered by Sydney
 

Loading Comments...
 

    %d