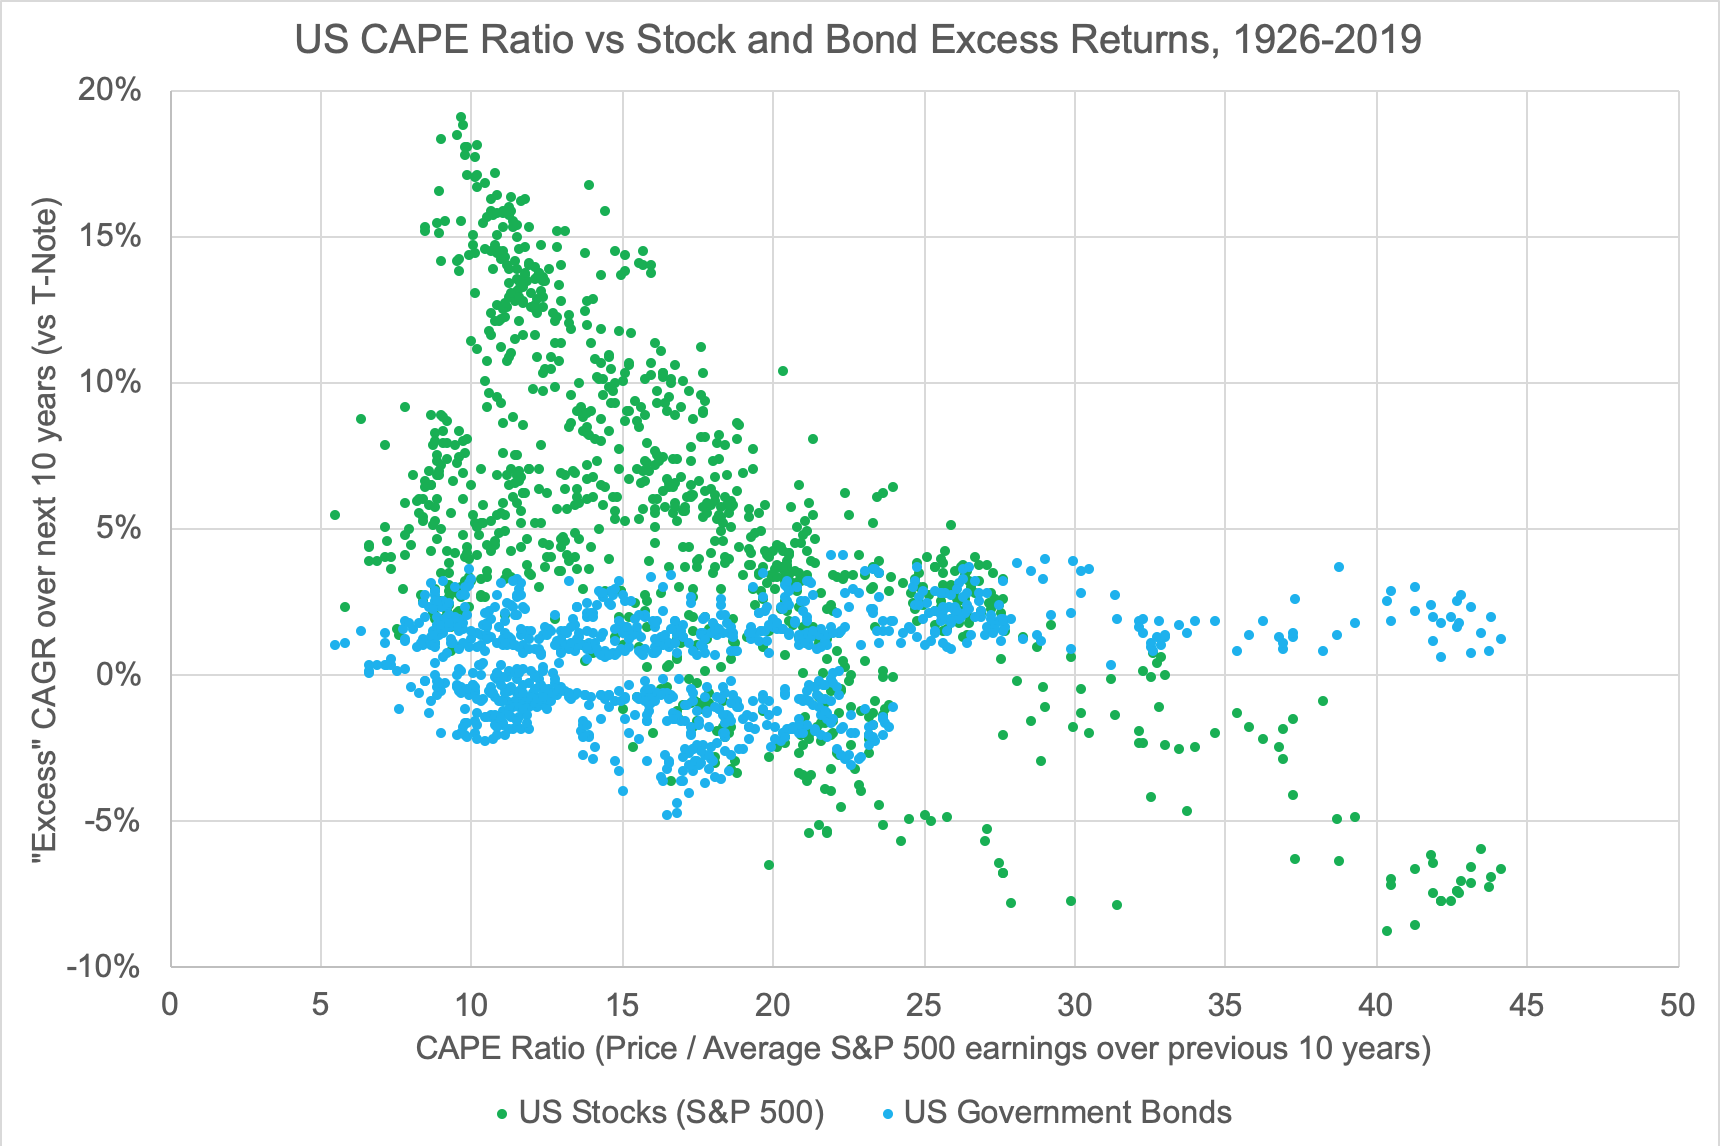
One of the most frequently asked questions I am sent is “what is the rate of return I should expect when I invest in the market”? With bonds, it is fairly easy to see that a short-term US Treasury note bought with a yield of, say, 2%, will return you 2% per year if held to maturity. Stocks, on the other hand, may have a long-term “average” rate of return of 10% per year, but of course that means a stock fund could go up 25% one year and down 15% the next, or vice versa. Following my earlier explanation of the only two ways to make money in stocks, I thought I’d share one of the most useful charts you can use to guesstimate the expected return of stocks and bonds you can assume over a, say, 10 year time horizon.
This chart is based on the “Irrational Exuberance” data kindly updated by Robert Shiller on his Yale website, and plots the compound annual rate of return earned by stocks (green) vs bonds (blue) over the following 10 years, in excess of the 10-year note yield at the time, versus the “CAPE” ratio at the beginning of the 10 years. “CAPE” stands for “Cyclically Adjusted Price to Earnings” ratio, and is simply a version of the classic P/E where the current price of the stock is divided by the average earnings of the last 10 years, not just the last 12 or next 12 months. The idea of the CAPE is that at the end of business cycles, earnings have risen rapidly on the back of higher debts, which will need to be paid back in the next recession, so it is smoother to average earnings over a typical business cycle length.
When I look at this chart, a few things immediately pop out at me:
- All but one period with >10% average stock returns over bonds happened when the CAPE ratio started below 20
- Most losing periods for stocks started with a CAPE ratio of 20 or higher
- There were very few periods where stocks made money starting with a CAPE above 30
- There very few (if any) periods where stocks lost money starting with a CAPE below 15
- When the CAPE was above 25, bonds averaged a total return 1-3% higher than the bond yield at the start of the period
- When CAPE was below 25, bonds sometimes returned more and sometimes less than the initial bond yield, the latter mostly happening in inflationary periods.


