Investors new to stock analysis might intuitively think that high dividend stocks are “better” than low dividend stocks. After all, if you were to invest $10,000 into a piece of a company, wouldn’t you prefer to own a company where the share of profits paid to you in cash were $400/year rather than $100/year, or even worse, no profit share at all? Today’s markets remind me all too much of 1999, given the emphasis I see placed on shares of companies that make little or no profits, and certainly pay no dividends, but seem to have no problems seeing their share prices soar. Today’s charts follow on from the one I posted earlier this week on high profit value vs low profit growth, and remind us of what should be obvious: over time, high dividend stocks outperform low dividend stocks. Data source is again the Ken French dataset.
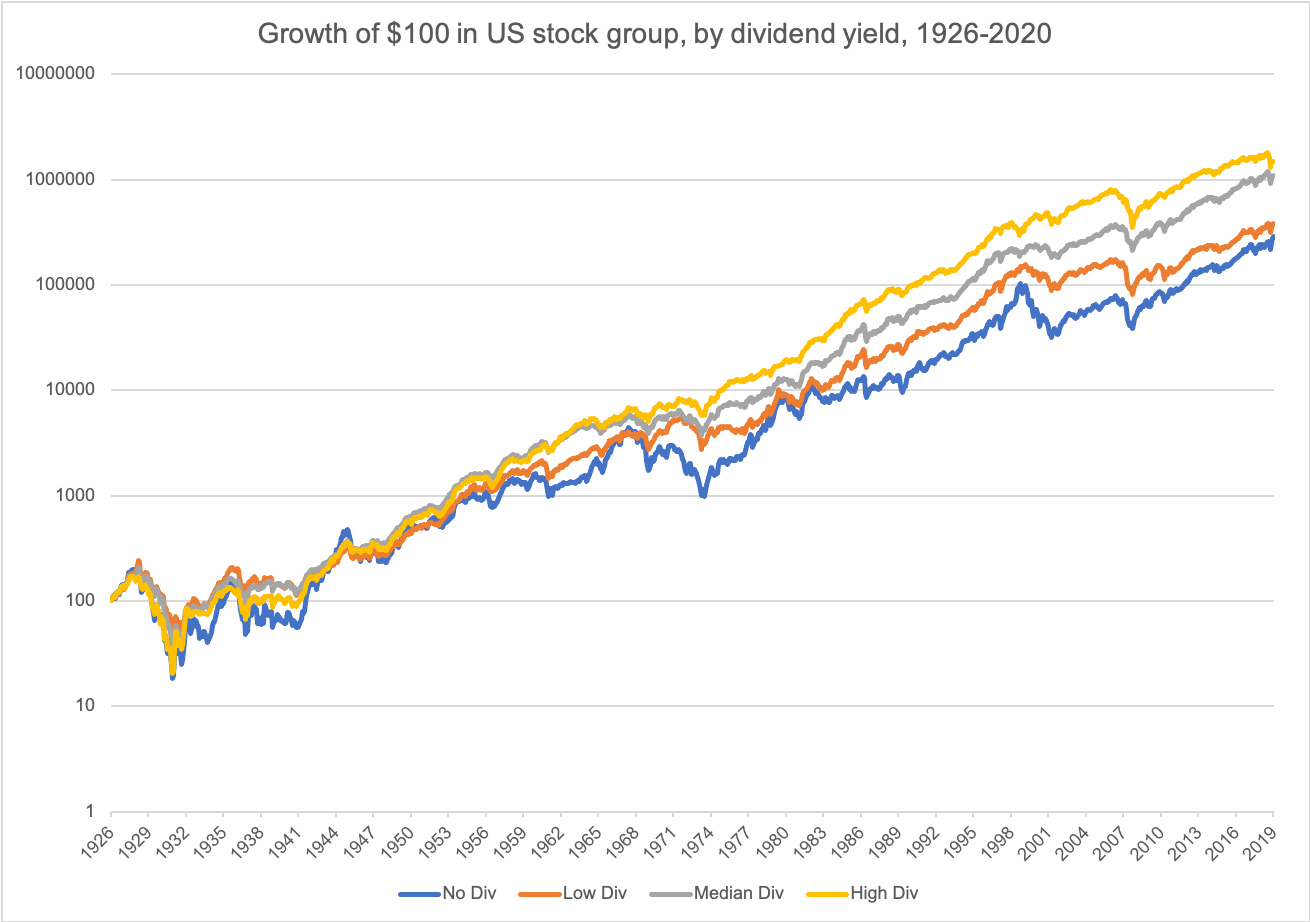
The first chart shows how $100 invested in four different buckets would have compounded over the years: stocks paying no dividend, the 30% of stocks with the lowest dividend yields, the 40% of stocks paying around median dividend yields, and the 30% of stocks paying the highest dividend yields.

It may not be too surprising that over long periods of time, the total return on high dividend stocks is simply much higher than that on stocks with low or zero dividend yield. Dividend yield, after all, is one of the oldest and simplest “value” indicators.
The second chart is the one I have found more important to run on these factor studies, showing rolling 10-year total rates of return of these four different buckets or strategies. What I find impressive about this chart is that despite the recent decade of underperformance, high dividend stocks have not had a “lost decade” in the US since the 1930s, and overall seem to have 10-year returns that deviate far less than the no dividend stock bucket, which before this also seemed to have significantly outperformed in the late 1990s, the late 1970s/early 1980s, and the late 1940s/early 1950s.

Sometimes simple is good, and charts like this can be good encouragement for those that simply want to hold on to good and stable companies with good and stable dividends.

