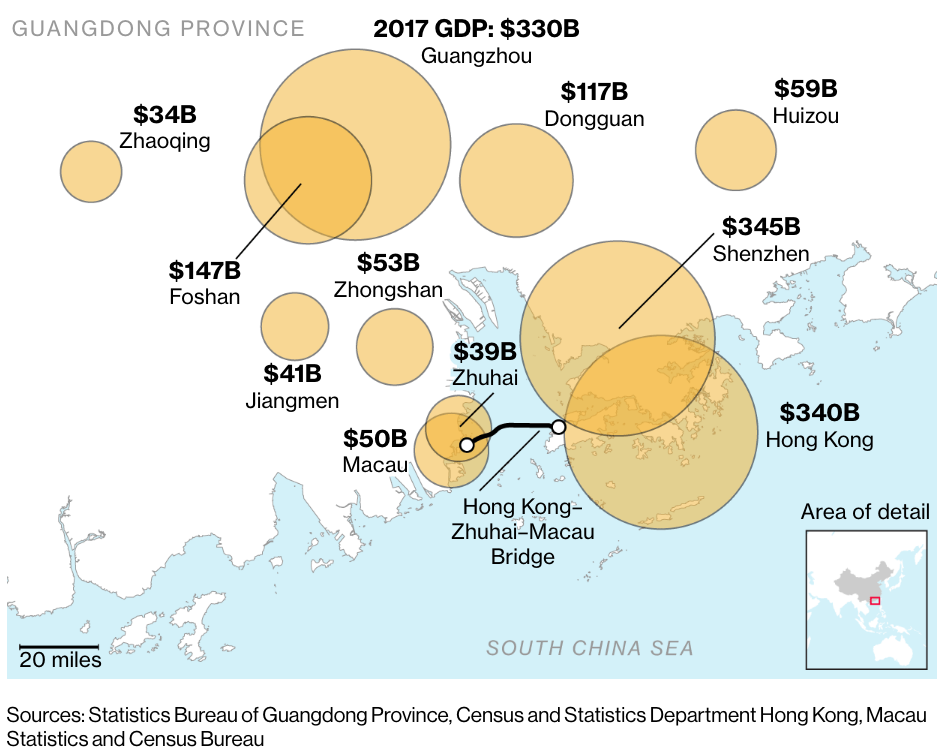
Today’s infographic comes from Bloomberg, whose article on the soon-to-be open bridge from Hong Kong to Macau and direct high-speed train to Guangzhou included a bubble map of the relative GDPs of the “Greater Bay Area”.
At the turn of the century, I lived in San Francisco where I often heard the term “Bay Area” to refer to all the cities around San Francisco Bay, from San Jose and Silicon Valley to the south, to Marin in the north and my alma mater UC Berkeley in the east. So naturally, it took me a while to get used to hearing the term “Greater Bay Area” and associating it with the cities of Hong Kong, Macau, Shenzhen, and Guangzhou in the “bay” around the Pearl River Delta.
The below chart also grabbed my attention by how the combined GDP of Hong Kong, Shenzhen and Macau was reported to be just over US$1 trillion in 2017, similar to how I remember reading of the $1 trillion “GDP” of California back in 1996. By comparison, the economy of California was estimated to clear $2.7 trillion in 2017, which is almost twice the size of the Greater Bay Area GDP plotted below, while California’s population is slightly lower at 40 million vs the Pearl River Delta’s 50 million.
Shenzhen has often been called the “Silicon Valley of China”, though has a reputation for being more focused on hardware than software. While Shenzhen stock connect has made it possible for me to look at adding shares of Shenzhen listed companies to offshore investment accounts, I still find too few shares listed there with the right balance of quality and valuation (that is, too many Shenzhen listed companies are too speculative and not enough of the “cash cow” type businesses I look for). Years ago, I also looked at how much cheaper Shenzhen real estate was vs Hong Kong property, and I understand this gap has also narrowed.


