Vanguard is synonymous with low-cost, passive investing. Here I present some charts showing some metrics that can be used to enhance an asset allocation of the top Vanguard mutual funds even among these broadly diversified, passive funds.
Despite my disagreements with him, Jack Bogle remains one of the foundational figures of today’s investing world I most admire, precisely because he made global asset allocation accessible and inexpensive to the average retail investor, at least in the US. This is why I offer professional management of US Vanguard accounts my clients prefer to keep at Vanguard, even though I encourage accumulating direct positions in select stocks in a separate account.
The biggest disagreement I have is how Vanguard mutual funds “market cap weight” their stock holdings. In other words, most Vanguard funds will invest in 10x as much in a company that trades at 10x the total market value of another stock, even though it may not be 10x as profitable or return 10x as much back to shareholders. My two most-read articles on SeekingAlpha are “Why I wouldn’t invest more than $100,000 in an S&P 500 index fund“, and “The first 10 stocks I would have a 10 year old buy” (instead of an index fund). So naturally, the first enhancement I would suggest to those who keep accounts in Vanguard mutual funds (which is a very safe and good place to keep them, I repeat) is to tilt these mutual funds to those allocated towards better value in earnings, growth, and shareholder yield.
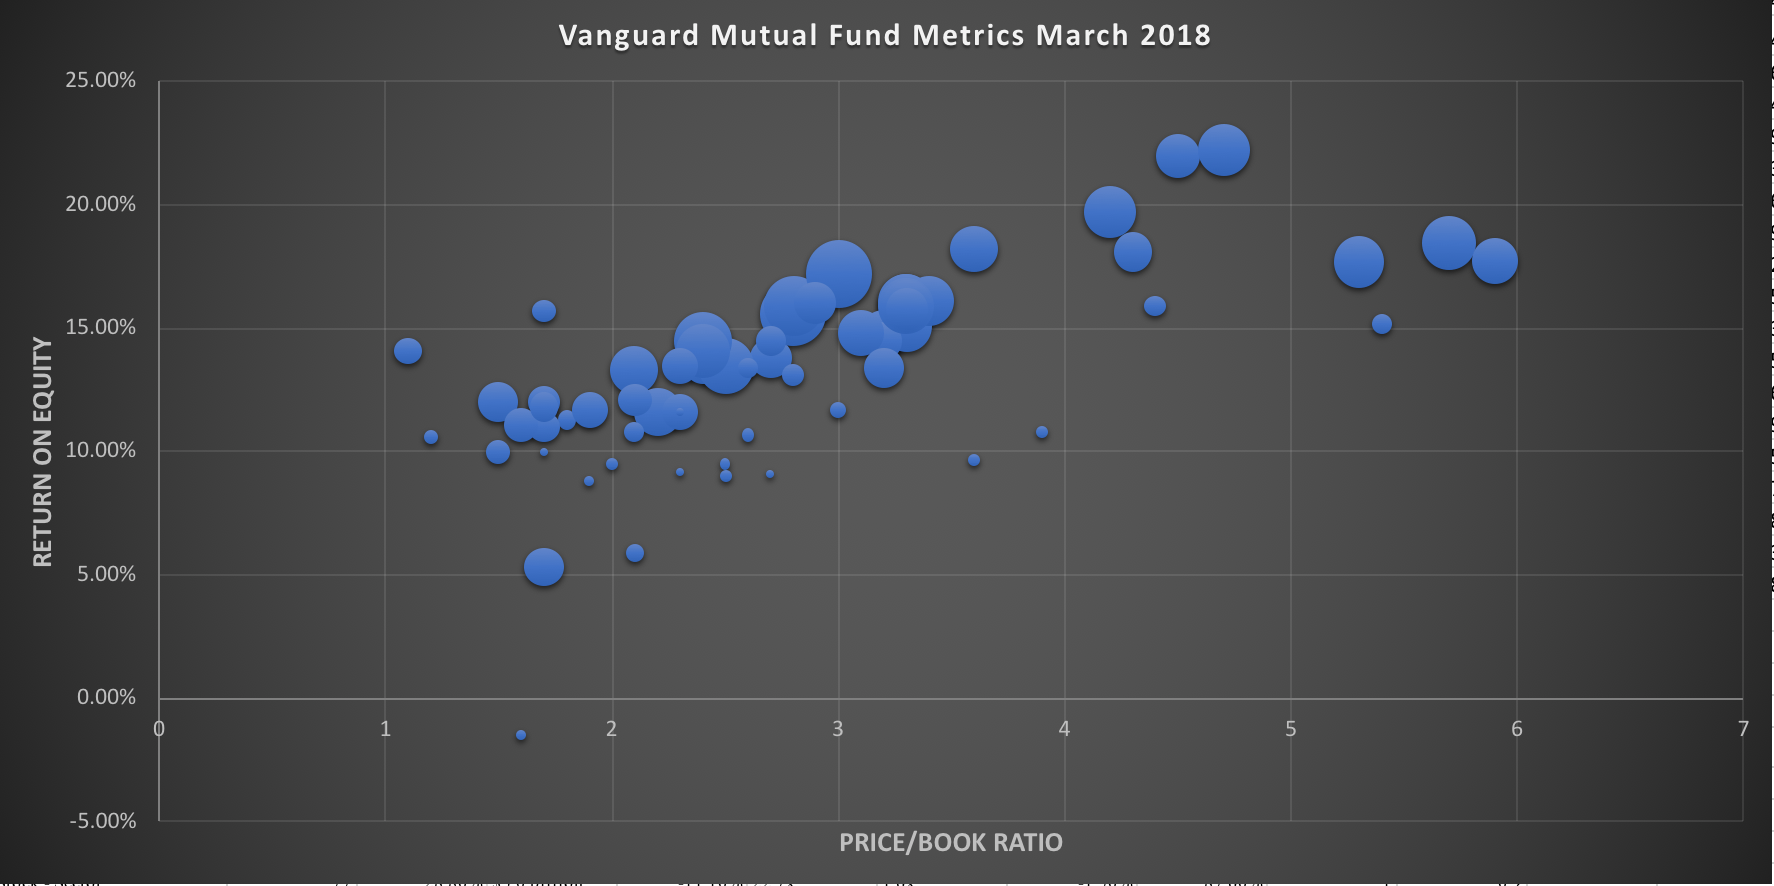
First, a scatterplot on the return on equity (ROE) metrics of Vanguard’s stock funds versus their Price/Book ratio. ROE is a measure of how much profit the stocks in each fund earn per dollar of book value, so the bubbles closer to the upper-left of this chart are the most “value-oriented” of Vanguard funds, and it is perhaps not surprising that there does seem to be a linear relationship among these diversified portfolios. Conversely, I avoid the funds below the “best fit” line of these bubbles, especially those most expensive funds on the far right and bottom of this chart.

Second, I might have another eye on P/E vs historical earnings growth (a form of backwards looking PEG ratio), though admit I am not a growth investor and do not like investing through a rear view mirror. In this case, the bubble all the way at the bottom is Vanguard’s energy sector fund, which we all know saw a steep decline in earnings, but is still trading at over 20x those earnings.

For reference, this is the screen within Vanguard.com I am getting these multiples from.

Hopefully these have been useful charts for thought on how to better allocate your Vanguard funds. I look forward to hearing from you if you have any questions about factor investing or asset allocation.

