Not a month has passed in the past three years when I haven’t had at least some conversational debate on the value vs growth styles of investing. I often emphasise the importance of not seeing value as the opposite of growth (it is just as possible to buy growth at a reasonable valuations as it is to overpay for growth), but rather, this division has long been a simplistic way funds divide stocks between those that trade at low multiples vs those that trade at higher multiples.
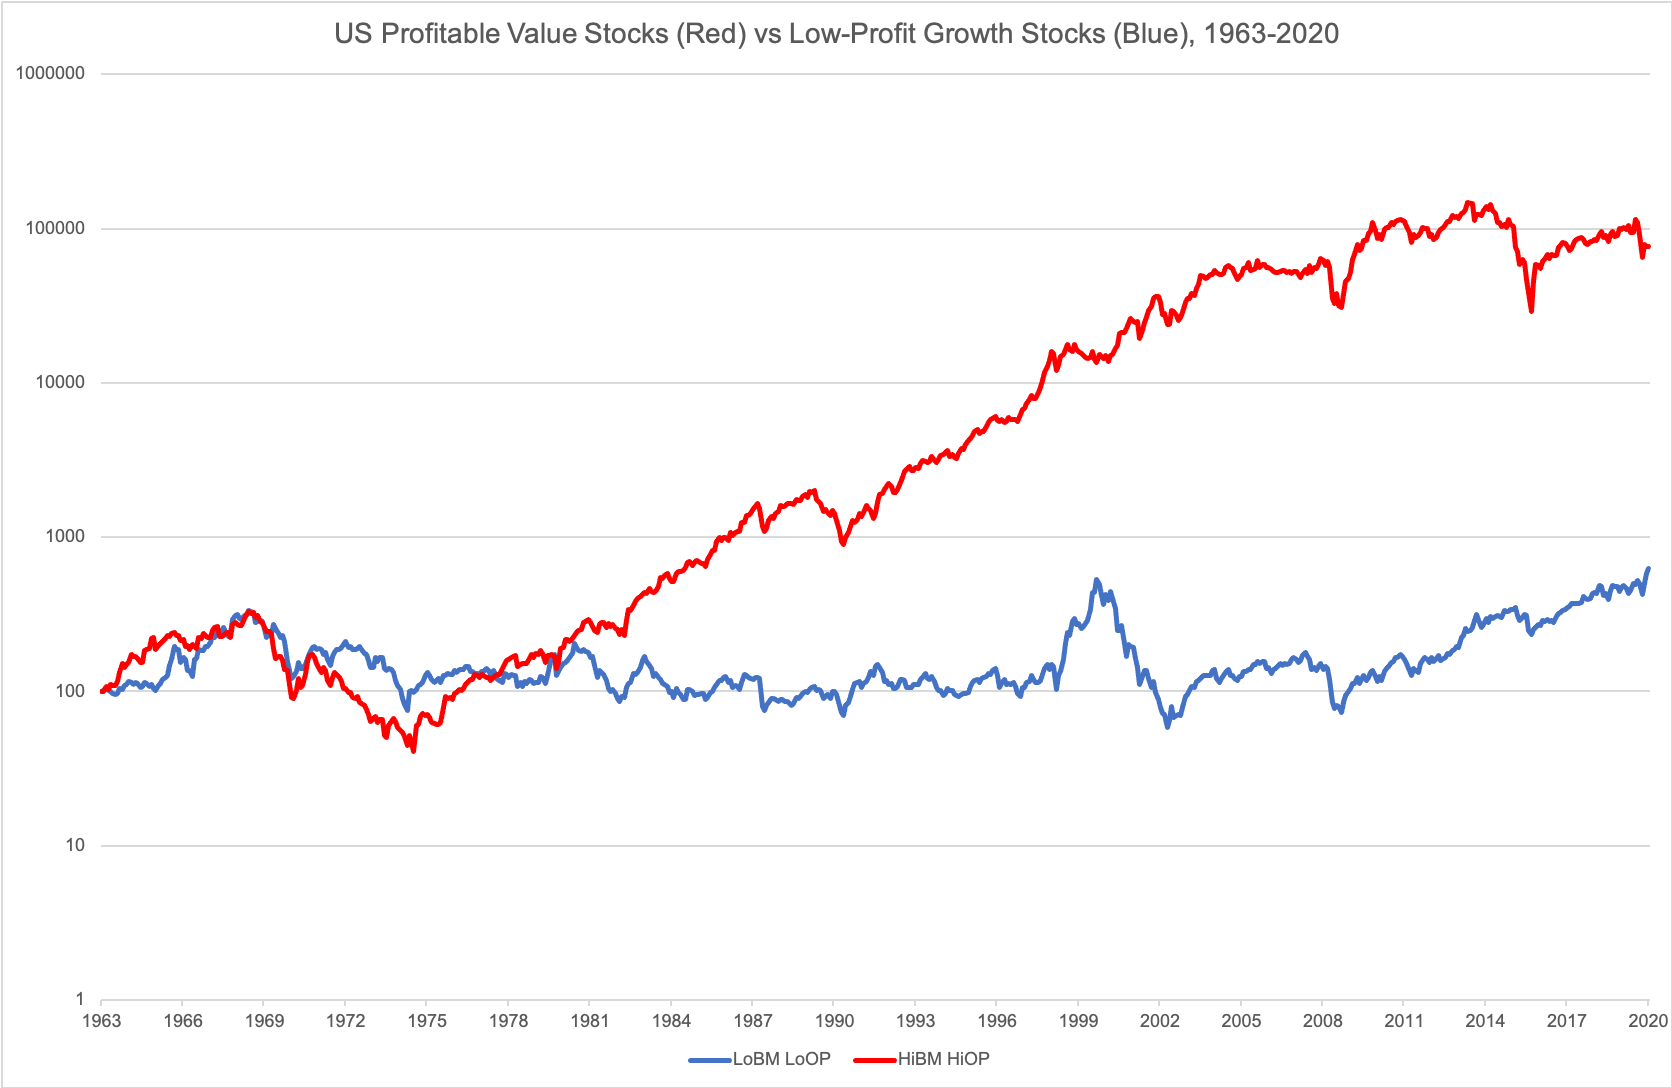
For today’s charts, I reference Ken French’s excellent data website, where there are several return series of stock portfolios sliced several different ways. In particular, I wanted to focus on the difference in returns between “highly profitable value” stocks vs “low profitability growth stocks”, where value is measured by Price/Book ratio (“high Book to market = value”), while profitability is a modified form of return on equity, a measure of quality. As one might expect, cheap and highly profitable companies have tended to significantly outperform expensive and barely profitable companies over most of the past 57 years:

Many investors who have been watching markets lately might say “sure, that may have been in the past, but low-profit growth stocks have been CRUSHING ‘quality’ value stocks for years so far”. The following chart shows 10-year rolling rates of return on these different quintiles of profitable value vs low quality growth, showing how historically exceptional these past few years have been. The last time low-profit growth outperformed quality value stocks seems to have been the 10-year periods ending in the early 1970s, and the current period is already longer than that last period, which was followed by significant inflation.

It is also worth noting that the most recent period of 10-year underperformance is also deeper than any spread seen in the early 70s, making me curious how much the Nifty Fifty of the 60s and 70s might compare with the big tech names of today.
For further reading, you may want to see my recent share of JP Morgan’s valuation quadrants, my earlier Russell comparison of growth vs value, and a comparison with 1999.

