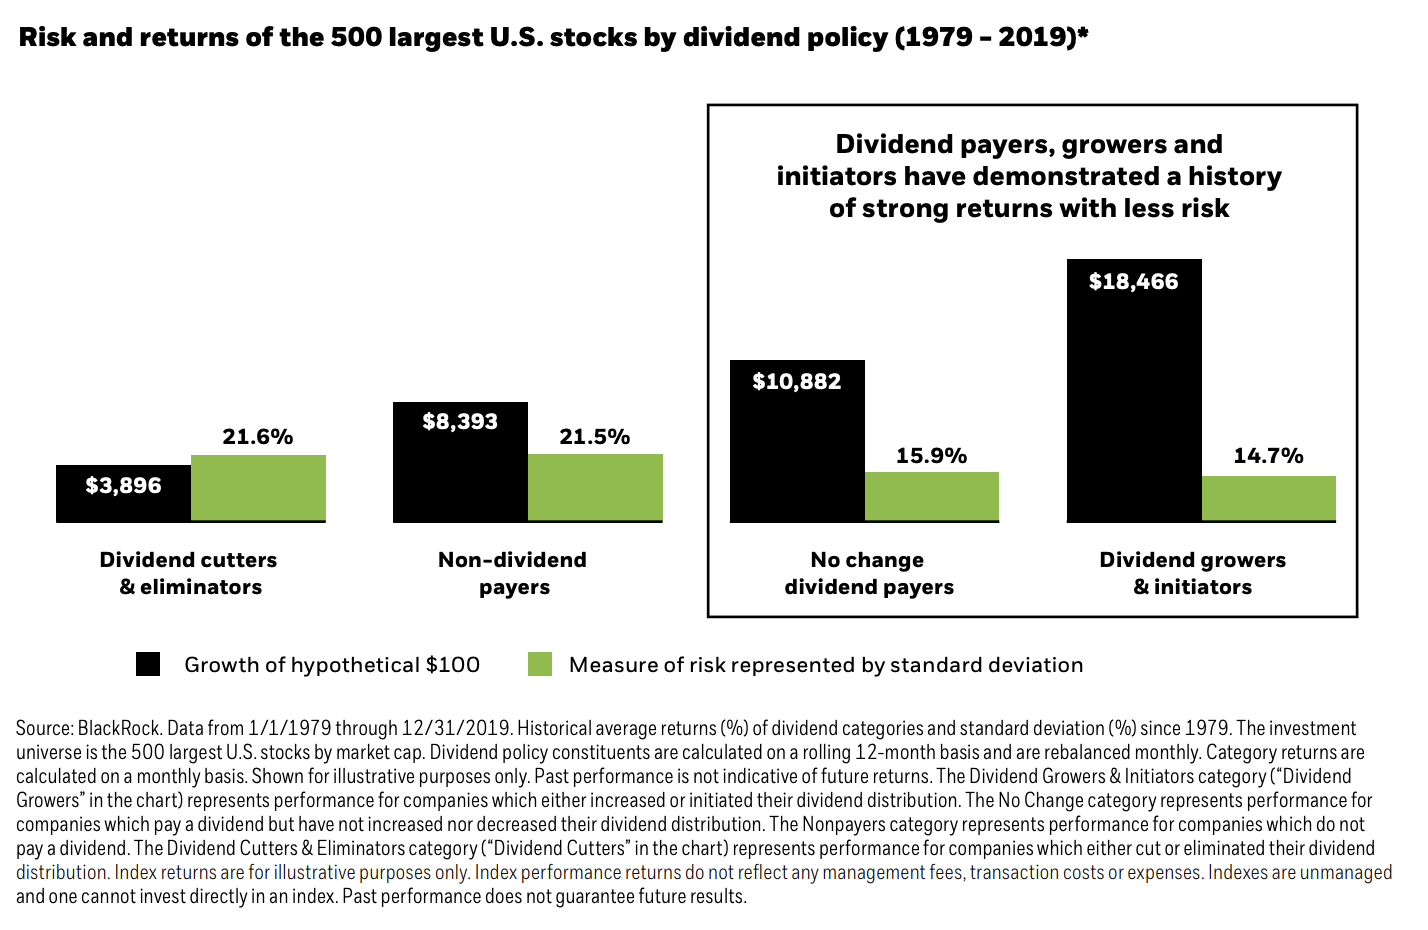
Today’s chart comes from the ETF giant BlackRock iShares, where in their guide to dividend investing with ETFs, they include on page 7 some surprising statistics about the performance of stocks who raise their dividends versus those who don’t (broken down by stocks who pay but don’t raise dividends, stocks that don’t pay dividends, and stocks who cut their dividends). This study covers the top 500 US stocks over the 40 year period ending in December 2019.
What may surprise some readers, especially who have been following the rise of the “FANG” stocks (Facebook, Amazon, Netflix and Google, none of which pay a dividend) over the past five years, is that dividend payers (without recent dividend cuts) have on average outperformed non-dividend paying stocks over the whole 40-year period. Even more remarkably, the stocks that raised their dividends not only posted more than double the return of non-dividend paying stocks, they did so without about 1/3 less market volatility (one crude measure of risk). In other words, there seems to be a case for investors to consider dividend growth for higher returns AND lower risk than simply chasing “growth stocks” or “value stocks”.
For those who haven’t followed recent market moves so closely, it should seem obvious that a stock that increases its payout to you over time should perform better than one that continues to not pay you, but some critics of “dividend first investing” point to the rise in preference for buybacks over dividends over this same period. In other post, however, I noted that dividends still made up 75% of the S&P 500’s returns over the same period.


