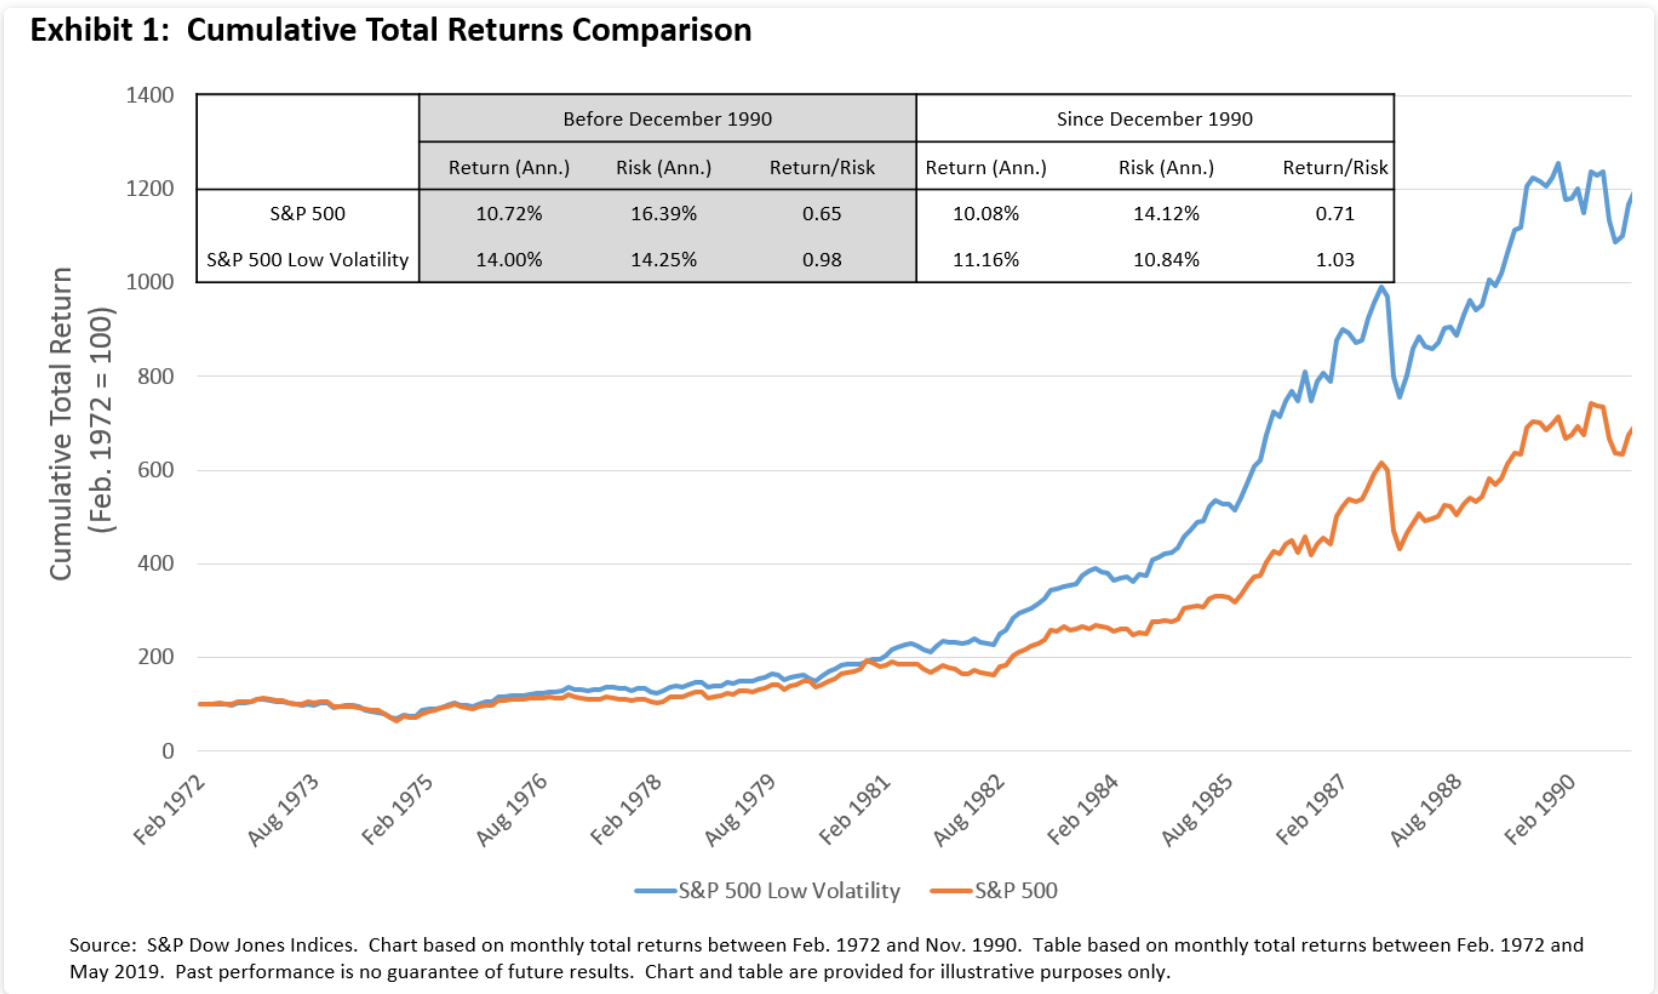
Today’s chart comes from one of the top 10 blog posts of S&P Dow Jones Index’s Indexology blog, showing how the low volatility factor has performed on US stocks over the past 40+ years since 1972. In other words, for the past several decades, the pattern for US stock investors has not been higher risk = higher return, but rather lower risk = higher returns.
The 2nd most memorable charts from these posts come from their post on dividends and buybacks, and how buybacks have been a driving force for US stock outperformance over the past decade.
Earlier this month, I also posted how low volatility still outperformed across many different countries over this past decade, but did not do as well as momentum.

